It's surprisingly unknown what the Mandelbrot set is, exactly. Almost everyone knows that it's a fractal and that it has some special properties (eg. related to zooming it), but not everyone knows what it is exactly and how it is calculated. There's also a lot of misunderstanding about it.
This document tries to explain in a simple and clear manner what the Mandelbrot set is.
The first part explains it in a more mathematical way. This might be a bit difficult to understand. However, the second part approaches the set in a more practical manner, how it can be calculated with a programming language.
Note: Some knowledge about complex numbers and set theory is necessary to understand this part.
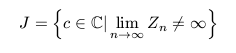
The Mandelbrot set is a set of complex numbers defined in the following way:
where:
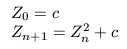
That is, the Mandelbrot set is the set of all complex numbers which fulfill the condition described above, that is, if the value of the (recursive) function Zn for the value c is not infinite when n approaches infinity, then c belongs to the set.
As with many other fractal functions, it is said that this function has an attractor, which in this case is located at infinity.
Attractors are related to the "orbit" of the function. This orbit is defined by the path formed by the values of Z at each step n. The orbit of Z for a certain value c either tends towards the attractor or not. In this type of fractals a value c causing the orbit of Z to go to the attractor point is considered to be outside the set.
The attractor of a fractal may not always be at infinity, and there even may not be just one attractor. For example the so-called magnet1 fractal has two attractors, one at infinity and the other at 1+0i.
Ok, that's nice, but how do I make a program that draws the Mandelbrot set?
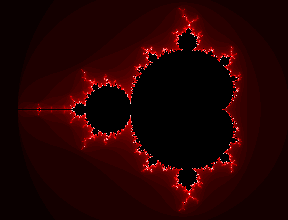
The Mandelbrot set (and other fractals) are usually drawn so that there are lots of nice colors around a black shape, like this:
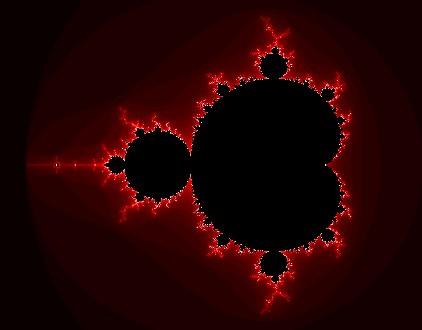
Many people think that the Mandelbrot set is formed by those colors, or that they are part of it.
Actually the Mandelbrot set is that black shape in the middle. Everything that is outside that black shape is not part of the set. (Actually drawing just the set itself and leaving everything else blank results in a pretty boring image...). The colors in those images are not, however, completely unrelated to the set itself.
When one examines the mathematical definition of the Mandelbrot set, some problems jump out. The definition talks about "infinity": n approaches infinity (that is, Z is calculated recursively an infinite number of times) and the value of Z can go to infinity and this has to be checked.
With real computers we can't deal with infinity. Even if we could assume that a really, really big number is approximately the same as infinity, we still can't calculate Zn an infinite number of times. Calculating it a really, really large number of times could be considered good enough, but that would take ages for the computer to do.
So we have two problems: The value of Z going to infinity and its value being evaluated an infinite number of times.
However, we are lucky this time:
1) It can be quite easily proven from the mathematical definition that if the absolute value of Z (that is, its distance from 0+0i) ever gets bigger than 2, it will never return to a place closer than 2, but it will actually rapidly escape to infinity.
This means that it suffices to check whether Z went farther away from origin than 2. If it went, we know that it will inevitably go to infinity. That is, we don't have to check it for infinity, just for 2.
2) How many times should we iterate Zn to see if it goes farther away than 2 or not?
Luckily just a few times suffices (the mandelbrot example image above used just 50 iterations).
In fact, it's not just luck: It's actually caused by the resolution limitations of the image we are calculating. Images are not infinitely accurate, but they consist of a finite (and quite low) number of pixels. After a certain number of iterations there's no considerable change in the image. A larger number of iterations doesn't give anything new to the image (the extra information given by the larger iteration amount is missed in the low resolution of the image).
If we zoom the set a lot, what we are actually doing is calculating an image with much higher resolution (although we only calculate "part" of the image) and thus the iteration amount has to be increased accordingly.
Another question is that if we are just calculating a set of complex numbers, how can we get a 2-dimensional image from it?
Complex numbers are 2-dimensional. They consist of two parts: The real part (the one without the i coefficient) and the imaginary part (the one with the i coefficient). In mathematics complex numbers are drawn in a cartesian coordinate system so that the x-axis represents the real part of the number and the y-axis represents the imaginary part (eg. the number 1+2i will be a point which x-coordinate is 1 and y-coordinate 2).
This is exactly what we are doing when we draw the Mandelbrot set. We just are drawing complex numbers on a 2D cartesian coordinate system: If c belongs to the set, we draw a point (eg. in black color) at the respective location, else we don't (or we use another color).
(This may sound pretty complicated at first, but when one understands what is it and with some practice, it becomes quite simple.)
The first thing to do when we are going to draw the Mandelbrot set in an image is to set the equivalence between pixel coordinates and complex numbers.
This means that each pixel in our image has to represent a complex number (in the complex plane, ie. the cartesian coordinate system). Then we will color that pixel according to whether it belongs to the Mandelbrot set or not.
There are basically two approaches to this:
Both ways are basically the same (the values needed for one can be calculated from the other), but they represent two different approaches to the same problem.
The first approach is more like having a coordinate around which to calculate the set (a variation of this is to have the pixel at the center of the image to represent the complex number) and a zooming value (the step between pixels). To zoom to a point we only need to decrease the step value.
This approach is sometimes quite useful.
However, I personally find the second approach easier to understand and use. Just define the four corners and calculate.
I usually define the area using this approach in this way:
MinRe = -2.0;
MaxRe = 1.0;
MinIm = -1.2;
MaxIm = MinIm+(MaxRe-MinRe)*ImageHeight/ImageWidth;
That is, I define that the minimum real part of the complex numbers (that is, the left border of the image) is -2.0 and the maximum (that is, the right border) is 1.0. This means that the real part of the complex numbers will go from -2.0 to 1.0.
In the same way I defined that the lower border of the image is equivalent to the imaginary part -1.2.
Now, I could have defined the upper border of the image in the same way,
eg. setting it the 1.2. However, setting it this way would stretch the
image a bit depending on the dimensions of the image. So what I do instead
is to calculate automatically the equivalent MaxIm according
to the image dimensions and the real part size.
How to calculate the complex values for the pixels in between?
If the pixel at the left upper corner of the image has (pixel) coordinates
[0, 0] and the pixel at the lower right corner of the image has
coordinates [ImageWidth-1, ImageHeight-1], then, to get the
equivalent complex number for a specific coordinate [x, y]
from the values set above (ie. MinRe etc) the formula is
the following:
 c_re = MinRe + x*(MaxRe-MinRe)/(ImageWidth-1);
 c_im = MaxIm - y*(MaxIm-MinIm)/(ImageHeight-1);
(Note that the imaginary part goes from positive to negative instead of the other way around since we consider the positive imaginary axis to be up, while the 'y' coordinate increases when going down.)
Although this seems pretty complicated, we can pre-calculate some things in those formulas to make that simpler. We see that these things are constant in that formula:
 Re_factor = (MaxRe-MinRe)/(ImageWidth-1);
 Im_factor = (MaxIm-MinIm)/(ImageHeight-1);
We can calculate Re_factor and Im_factor right
after we have defined MinRe, MaxRe, MinIm and MaxIm
and when we have to calculate the complex number equivalent to a point
[x, y] we can make it this way:
 c_re = MinRe + x*Re_factor;
 c_im = MaxIm - y*Im_factor;
So we get the base code for our Mandelbrot drawing program (here in C++, but easily programmable in almost any language):
double MinRe = -2.0;
double MaxRe = 1.0;
double MinIm = -1.2;
double MaxIm = MinIm+(MaxRe-MinRe)*ImageHeight/ImageWidth;
double Re_factor = (MaxRe-MinRe)/(ImageWidth-1);
double Im_factor = (MaxIm-MinIm)/(ImageHeight-1);

for(unsigned y=0; y<ImageHeight; ++y)
{
    double c_im = MaxIm - y*Im_factor;
    for(unsigned x=0; x<ImageWidth; ++x)
    {
        double c_re = MinRe + x*Re_factor;

        // Calculate whether c belongs to the Mandelbrot set or
        // not and draw a pixel at coordinates (x,y) accordingly
    }
}
The code goes through each pixel in the image and calculates the equivalent
complex number for each pixel into c_re and
c_im.
Now we only have to calculate the part left out in the place of the comment in the above code.
So now we just have to calculate Zn with c being in this
case c_re + c_im*i.
How do we do that?
First we have to decide how many times we want to iterate the function (as described earlier) and then loop that many times calculating the new value of Zn at each loop. Like this:
        double Z_re = c_re, Z_im = c_im; // Set Z = c
        bool isInside = true;
        for(unsigned n=0; n<MaxIterations; ++n)
        {
            if(/* Absolute value of Z */ > 2)
            {
                isInside = false;
                break;
            }
            /* Z = Z2 + c */
        }
        if(isInside) { putpixel(x, y); }
This iterates MaxIterations times, and in each iteration it
looks whether Z is greater than 2. If it is, it sets isInside
to false (as we saw earlier, if the value of Z ever goes farther away than
2 from the origin, c doesn't belong to the set).
We are now only missing the absolute value of Z and the function
Z2+c.
The absolute value is easy. The absolute value of a complex number is
defined as its distance from the origin, that is,
sqrt(Zr2+Zi2)
Note: The if-statement above would have the following form:
if(sqrt(Z_re*Z_re + Z_im*Z_im) > 2)
However, from mathematics we know that we can simplify that to:
if(Z_re*Z_re + Z_im*Z_im > 4)
which is a lot faster to calculate since we don't need the square root anymore.
And what about Z2+c?
The addition of two complex numbers is simple. Just add the real parts and the imaginary parts together. However, complex number multiplication is not that easy. We can deduce mathematically how the multiplication can be calculated:

So we see that in the result of the multiplication the real part is a2-b2 and the imaginary part is 2*a*b.
Knowing this we can write the Z2+c part of the
code:
            double Z_im2 = Z_im*Z_im;
            Z_im = 2*Z_re*Z_im + c_im;
            Z_re = Z_re*Z_re - Z_im2 + c_re;
So now, at last, we can write the whole thing (a little bit optimized if you notice):
double MinRe = -2.0;
double MaxRe = 1.0;
double MinIm = -1.2;
double MaxIm = MinIm+(MaxRe-MinRe)*ImageHeight/ImageWidth;
double Re_factor = (MaxRe-MinRe)/(ImageWidth-1);
double Im_factor = (MaxIm-MinIm)/(ImageHeight-1);
unsigned MaxIterations = 30;

for(unsigned y=0; y<ImageHeight; ++y)
{
    double c_im = MaxIm - y*Im_factor;
    for(unsigned x=0; x<ImageWidth; ++x)
    {
        double c_re = MinRe + x*Re_factor;

        double Z_re = c_re, Z_im = c_im;
        bool isInside = true;
        for(unsigned n=0; n<MaxIterations; ++n)
        {
            double Z_re2 = Z_re*Z_re, Z_im2 = Z_im*Z_im;
            if(Z_re2 + Z_im2 > 4)
            {
                isInside = false;
                break;
            }
            Z_im = 2*Z_re*Z_im + c_im;
            Z_re = Z_re2 - Z_im2 + c_re;
        }
        if(isInside) { putpixel(x, y); }
    }
}
(Notice the little optimizations made in the code and where do they come from?)
If we draw this (supposing that our background color is white and the drawing color is black) we see that yes, we get the basic Mandelbrot image, but it's pretty boring:
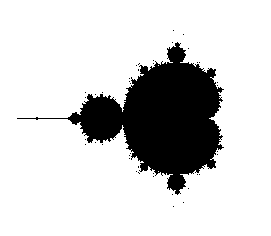
The main problem in this image are the missing parts. In fact, they are not missing, but we just "jumped over" them (we don't calculate each and every c, but just those that correspond to our pixels) and thus they didn't get into the image.
How do we get those fancy colors around the set?
In fact, there are many ways of getting colors outside (and even inside) the set. If you have used fractal drawing programs you have probably seen more than one way of coloring.
The classical way and also perhaps the most useful way of coloring the exterior of the set is to use the value of 'n' after the inner loop has ended. That is, using the number of iterations that was needed for Z to get larger than 2.
In practice, after the inner loop has ended (the one with n being the loop index) we get a value for n that is between 0 and the maximum number of iterations. If n is the maximum number of iterations then we know that Z did not get larger than 2 and the current c is (most probably) part of the set and we can color that with black (or whatever color we want).
If, however, n is smaller than the maximum number of iterations then we know that this c does not belong to the set and then we can map the value of n to a color and draw the point with that color.
If in our example we map n to a color so that from 0 to
MaxIterations/2-1 the color goes from black to red and from
MaxIterations/2 to MaxIterations-1 the color goes
from red to white, we get the following image:
The colors are not only visually appealing, but they also give us a lot of extra information that didn't show up in the colorless version. The shapes formed by the colors are not coincidence, but they are closely related to the set itself.
The Mandelbrot set has the property that for a value which is close to the border of the set it will take longer (that is, more iterations) to escape to infinity than for a value which is farther away from the border of the set. This means that our colors are actually saying to us where the border of the set is: The brighter the color, the closer the border of the set is.
This is very useful. Looking at the colors we can see where the "hidden" part of the set is (although it's not really hidden, it's so small that the resolution of the image can't show it). That is, the colors bring up the shape of the set a lot more clearly.
The importance of the colors become more clear when we zoom into the set (that is, we calculate a part of the set with higher resolution). For example:
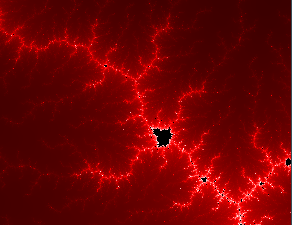
Without the colors we would get just few black pixels here and there which don't say anything to us. The colors, however, show us where the border of the set is.
You can easily experiment with other coloring methods (such as coloring according to the distance of the last value of Z, or only the real or the imaginary part of this value, and so on). Very interesting images can be achieved this way. However, those are seldom so useful as the classical way (but they can have a strong artistic meaning).
The Mandelbrot set has some special properties that make it quite interesting. (Proving mathematically most of these things is quite difficult, but it has been done for most of them.)
The Mandelbrot set is connected, that is, there's always a path from one point of the set to another point of the set so that all the points in the path are also in the set. This means that there are no disconnected "islands". (This property can be used to speed-up the calculation with specialized algorithms.)
The area of the set is finite (it fits inside a circle of radius 2; the exact area has only been approximated), but the length of its border is infinite.
If you take any part of the border of the set, the length of this part will also be infinite. This means that the border of the set has "infinite details", that is, you'll never find a place where the border is smooth, with a finite length (when calculating the set with a program you can get images where it seems that the border is smooth, but that's always caused because a too low iteration amount and/or image resolution is used).
Thanks to the last property you can zoom into any part of the border of the set and always get something to see (as long as you have enough resolution, you make enough iterations and your numbers don't overflow/underflow).
Mathematically the set is defined to have a dimension which is larger than 2 but smaller than 3 (that is a fractional dimension, hence the term "fractal").
The Mandelbrot set has also many visually appealing properties which are harder to explain. The border of the set is not random, but the shapes formed by it are visually very appealing, usually quite organic-looking. The border of the set is also infinitely rich in details, which means that you will always get something new if you start to zoom to a certain point. The internet is full of images of the Mandelbrot set; they are countless.
The reason why an extremely simple formula like Zn+1=Zn2+c can give such richness in details is a mystery to me. One could suppose that this kind of formula would give either a smooth and regular shape or just random points.
One cannot study the Mandelbrot set without hearing about the Julia set as well. Almost always when the Mandelbrot set is discussed or explained, the Julia set is also mentioned. This document is no exception.
So what is the Julia set and what is it relation to the Mandelbrot set?
Many people have seen Julia sets like this:
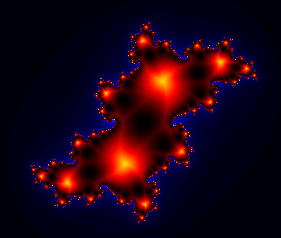
(In this image the interior of the set is colored with a special algorithm instead of being black and the exterior is colored with shades of blue.)
Julia sets can be quite pretty, but their connection to the Mandelbrot set is not clear.
The first connection is the mathematical definition of the set. It's almost identical to the Mandelbrot set:
where:
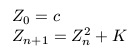
The only difference to the Mandelbrot set is that the generic Zn function is not "Zn+1=Zn2+c", but "Zn+1=Zn2+K", where K is some chosen (constant) complex number.
This means that although there is only one Mandelbrot set, there are many Julia sets (actually an infinite amount), one for each possible K (ie. one for each complex number).
Modifying our example code to draw a Julia set instead of a Mandelbrot set is so trivial that I'll not bother repeating the code here, but I'll let it as an exercise. To begin testing, try with a value of 0.353+0.288i for K to get a decent-looking Julia set.
So what's the connection between the Julia set and the Mandelbrot set besides their formulas being almost identical?
The value of K has a quite interesting relation with the Mandelbrot set:
For these reasons it is said that the Mandelbrot set is a "map" of all the Julia sets.
These properties can be clearly seen by making a specialized program: For example it could draw the basic Mandelbrot set in one window and in another window it could draw (preferably in real-time) the Julia set correspondent to the number below the mouse cursor (when it's over the Mandelbrot set image). Moving slowly the cursor over the Mandelbrot set modifies the Julia set in a way that it becomes quite clear what is the relation between the two.
Current computers are so fast that this kind of real-time Julia drawing is perfectly possible (at least for a small window, like 400x400 pixels or so). If you don't have any program like this and you know how to program, it could be worth the efforts to make a program like this. Exploring the relation between the two sets is a lot of fun this way.